A good place to get information on mobile systems is the report of COST231, which is available as a PDF or postscript file on the web.
http://www.lx.it.pt/cost231/final_report.htm
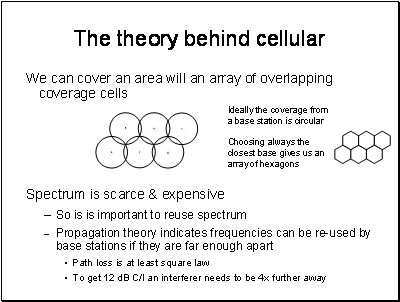
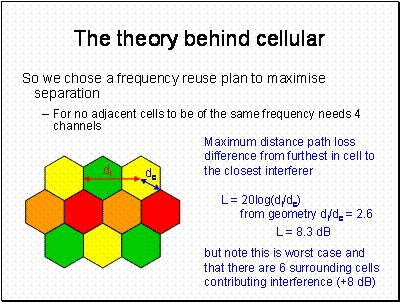
Hexagon Geometry:
In our 4 frequency design
dc = 1
di = 3 x (Ö3)/2 = 2.6
L = 20log(2.6) = 8.3 dB
(assuming a square law path loss)
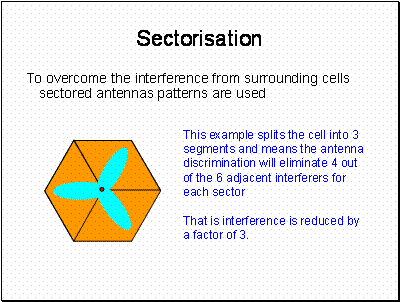
Sectorisation is extensively used as it also allows more capacity and increased antenna gain. Sector antennas are also used for WiMAX type services for the same reasons.
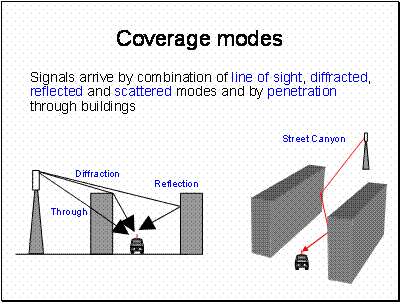
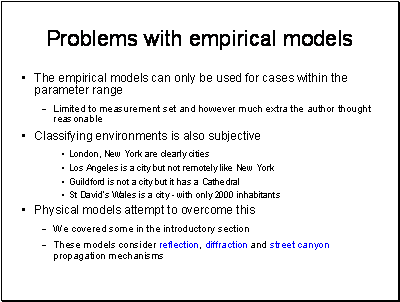
Street Canyons really do exist – the typical suburban street does not look much like a canyon – but that is because we are viewing it optically. The longer wavelengths of mobile systems are more likely to “see” buildings as flat screens as drawn here. At VHF streets are only a few wavelengths across and we need to use a different model taking more account of diffraction.
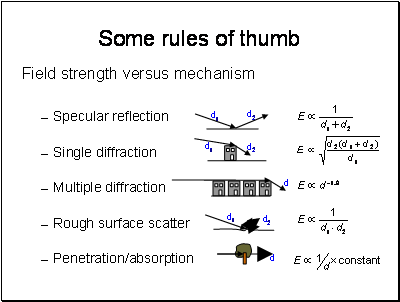
These really are only rough guidelines - also note here we are talking about field strength, for power you need to take the square.
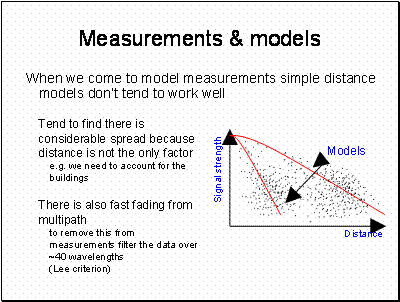
In the above example, we may find there is one model for rural areas and another for cities
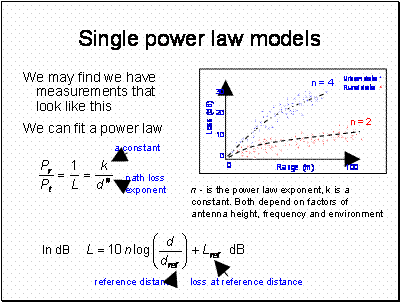
This simple model is not usually very good (except of course in free space where it is exact) – but you can do the maths in your head and it gives an indicative result. Lref will be a function of frequency. The best known example of this equation is
Free Space Loss = 32.45 + 20log(d) + 20log(f) dB where d is in metres and f in MHz.
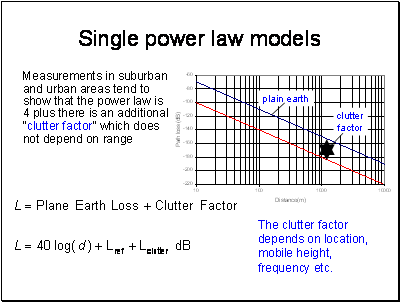
Why it is 4 we will explain later. Clutter loss does not depend on the range of the path but it does depend on how far the signal passes through the clutter.
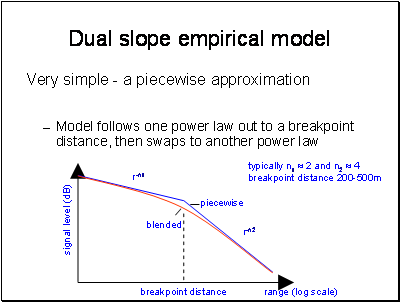
This actually comes from Physics. We will see later that we have a free space loss section and then a multipath section of the path.
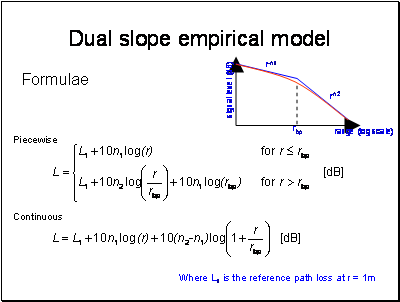
The advantage of this model is that it is very quick to code up and run. The slopes and breakpoint are often parameterised, or made available in the form of tables for each environment and frequency band.
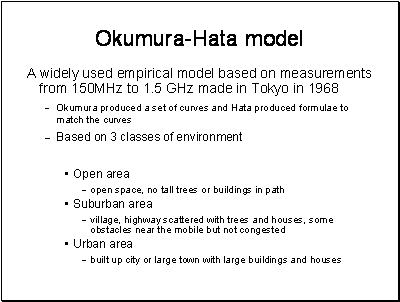
Unfortunately, there is no consistency over environmental categories between models. A large town or city is taken to imply the mean building height is above 15m
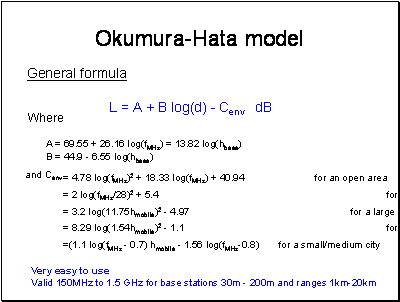
A set of equations is given in the slide. Several variations of these fits exist but the ones above are generally accepted.
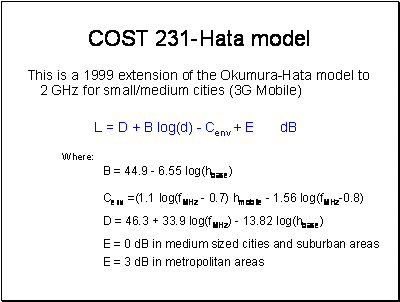
The COST231 version of the Hata model is available on the web in the COST231 report.
Extract from COST231:
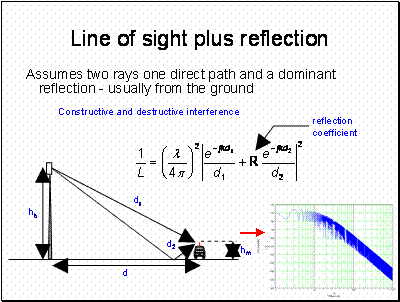
Note how the slope of the path loss curve becomes proportional to 40log(d) beyond about 20m. Also note that there is a lot of variability with range, this is experienced in practice as multipath fast fading. This is something that has to be accounted for in the design of the mobile system.
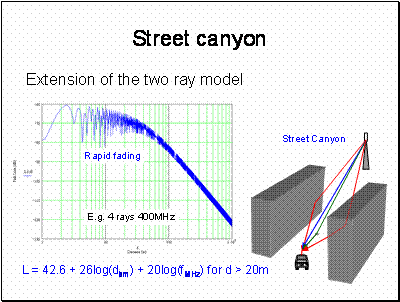
The plot is the same as in the previous slide except we now have 4 components contributing to the signal. Beyond 20m the signal variability is much reduced compared with the 2 ray case.
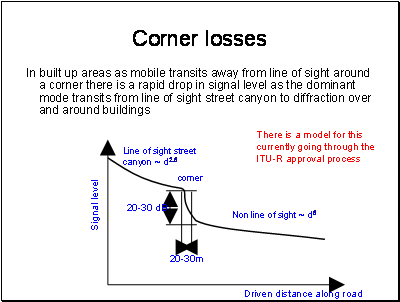
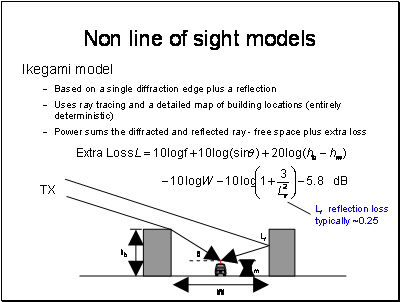
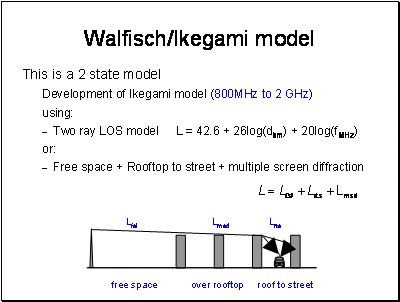
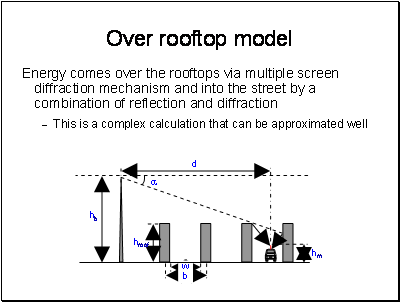
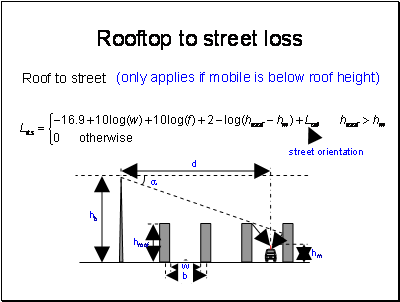
Frequency here is in MHz and distances and heights are in metres.
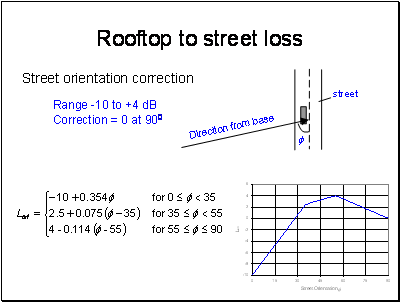
This odd looking function takes account of the reduction in the diffraction angle if the street is not perpendicular to the incoming ray combined with the loss of a reflection off the rear wall. This is why the function increases the loss above 300. The -10 dB region is a gain caused by the ray coming along parallel to the street with very much lower low diffraction angle.
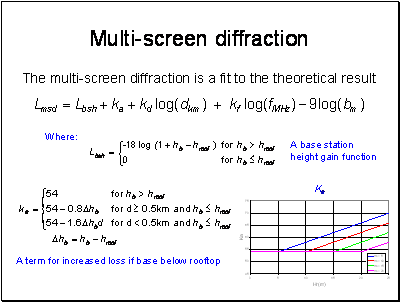
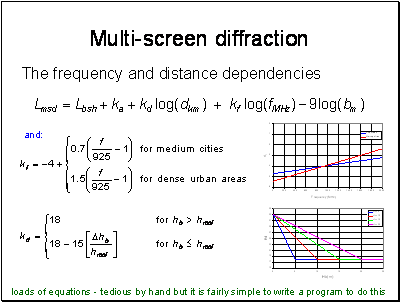
comparisons with measurements show good agreement when the base is above the roof height, a mean error of +- 3dB and a standard deviation of 4-8 dB. This model does not work very well for cases where the base is below the height of the roof – especially hb << hroof.
The model is based on work by Walfisch and Bertoni and gives good results once l (length covered by the buildings) is beyond the settled field distance ds.
If l < ds, grazing incidence occurs and the model is poor.
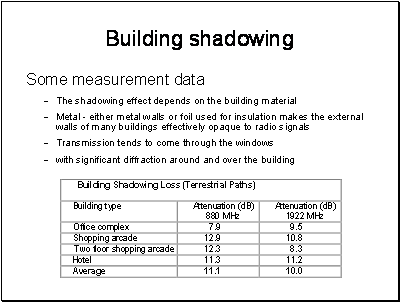
Shadowing loss measurements - either measure then build building and re-measure or stand behind existing building measure signal, demolish the building and re-measure. Not very practical and very expensive.
In practice, the measurement involves finding two paths with and without a building that are essentially the same. This is not as easy as it might appear, especially at low frequencies.
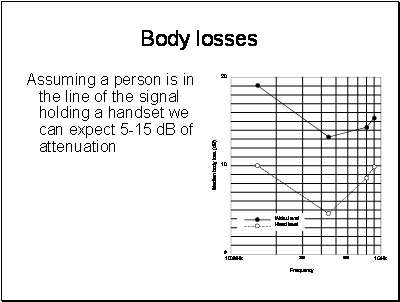
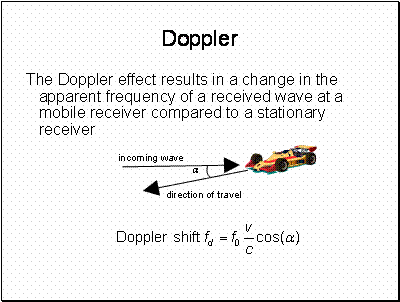
Everybody knows this – but just in case.
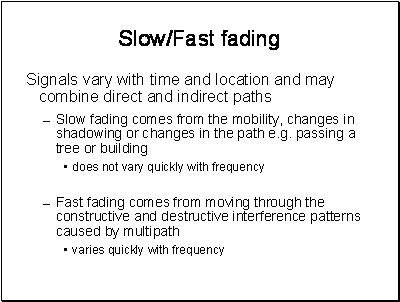
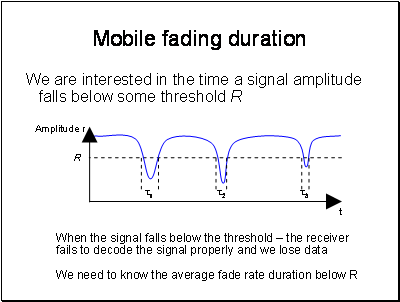
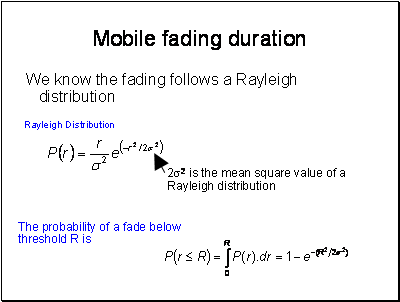
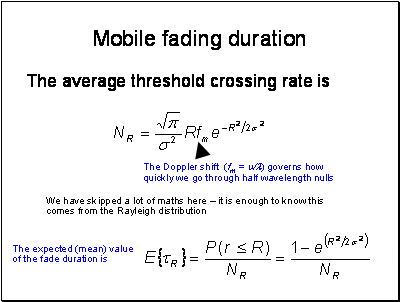
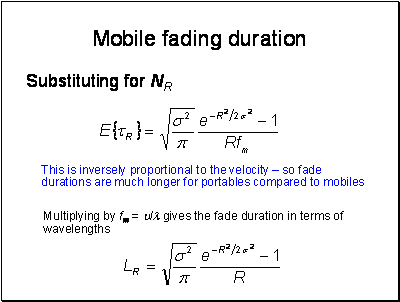
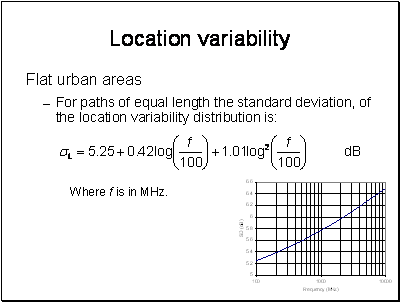
In analysing measurements, the fast and slow fading can be separated thus:
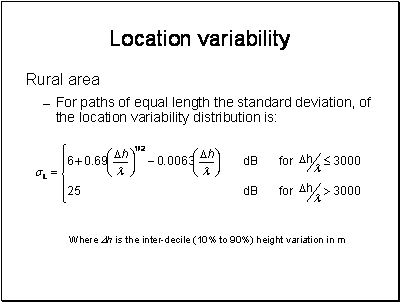
Measurements should be made at equal intervals over a distance of about 40 wavelengths, and a median signal level or path loss found for this distance. About 36 such measurements are required to obtain a median accurate to within 1 dB with 90% probability.
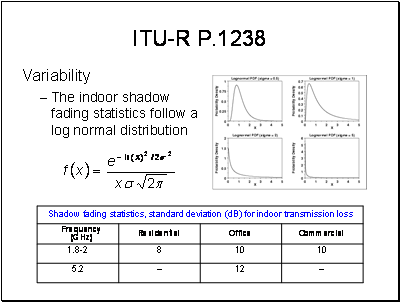
Experience has shown that the distribution of these median values will be log-normal, and therefore their distribution can be characterized by their mean or median, and their standard deviation. This is the distribution of signal strength variations due to shadowing, with the multipath variation removed.
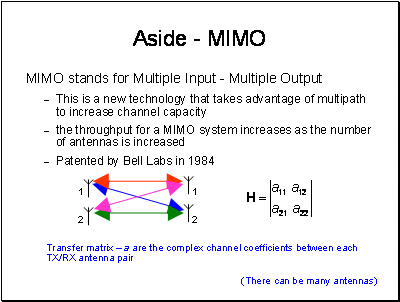
This is not a course on MIMO, the subject is far too large to do any more then mention it as a new technique taking advantage of rather than suffering impairment from multipath.
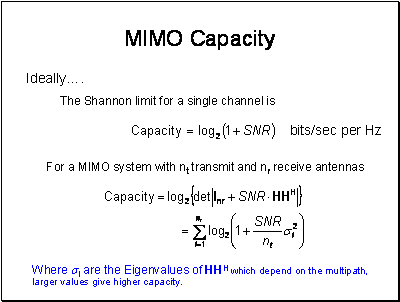
A full description of how MIMO works is beyond the scope of this course.
In a MIMO system with Nt transmitter antennas and Nr receiver antennas, transmitting Ns data streams, the input-output relationship can be described as
y = HWx + n
where x are the Nt vectors of transmitted symbols, n and y are the Nr received vectors of noise and signal. W is the Nt by Ns matrix of pre-coding applied to each transmitted symbol and H is the channel transfer matrix.
The transmitter symbols are Ns-fold spatially multiplexed over the MIMO channel, i.e. Ns streams are transmitted in parallel, leading to a theoretically Ns-fold increase in spectral efficiency. Ns can’t be more than the maximum dimension of H.
The reason for W is to pre-code the symbols in the vector to enhance the performance.
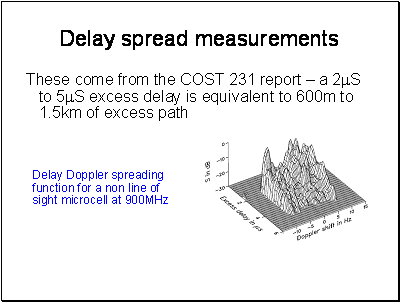
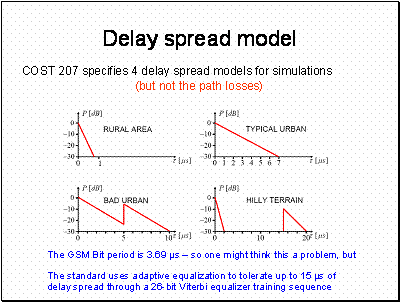
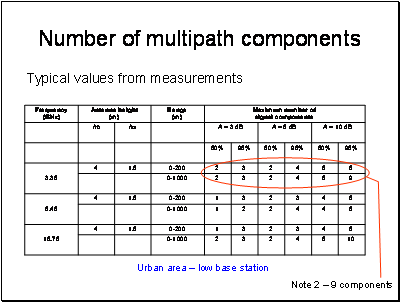
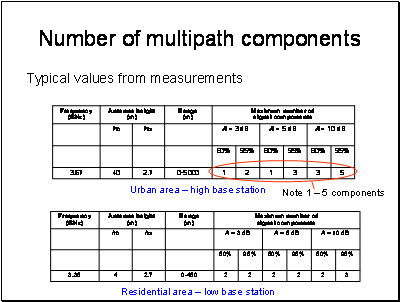
.You can find these in the COST 207 report.
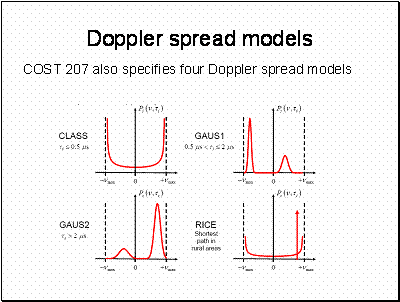
.
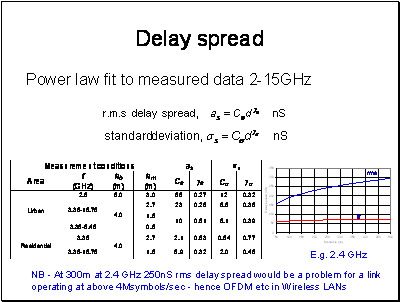
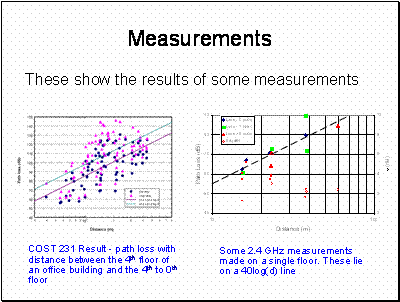
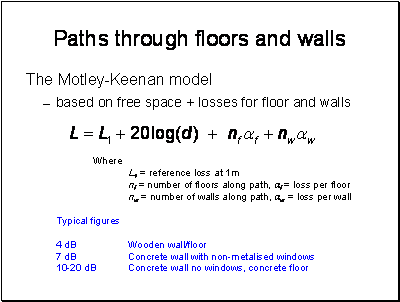
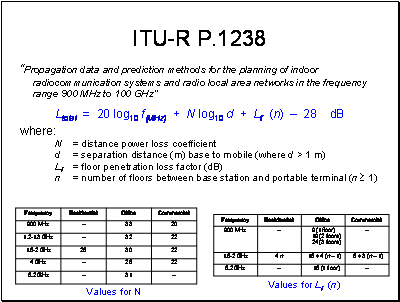
The COST 231 measurements were made by fixing a transmitter on the 4th floor and moving a receiver around between floors 4,3,2,1 and ground. The path losses show considerable spread and this is because the paths vary considerably depending on which floor the measurement was made and how many walls and floors the signal had to traverse.
The 2.4 GHz measurements were made using a long term average over 30 minutes. They appear to fit an approximate 30log(d) path loss function.
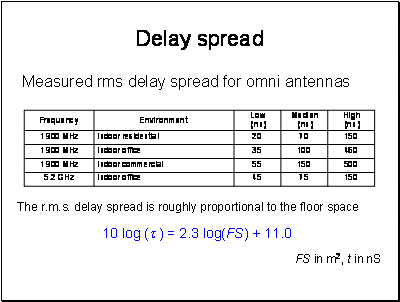
The low Median and High refer to the variability of the sites, it is not expected to get delay spreads below the Low value, most sites will be around the median value and some will be towards the high value.
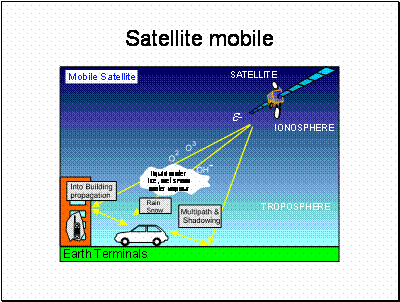
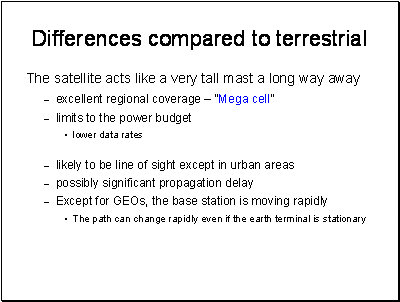
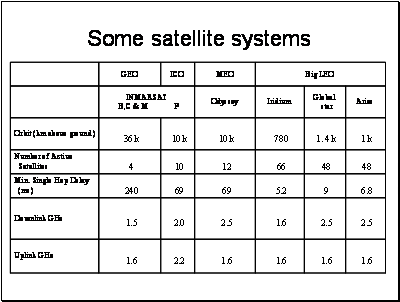
There are hundreds of satellites in orbit.
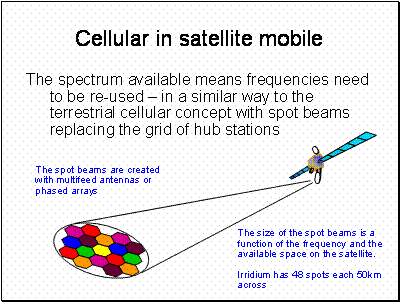
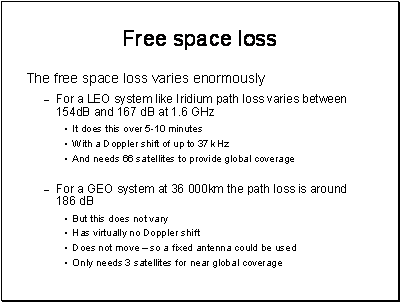
Iridium is element number 77. The satellite constellation was originally intended to have 77 satellites – hence the name.
The path loss for GEOs and the constraints of the satellite platform are such that they really need to be used with higher gain antennas. These are not ideal for mobile use. Advances in electronically steerable arrays has renewed the interest in using GEOs for mobile communications. There is much more bandwidth available in higher frequency bands, where more antenna gain is also practical for providing data links to aeroplanes and ships.
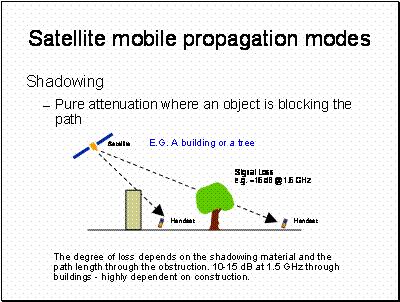
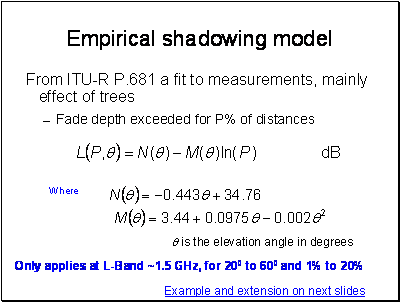
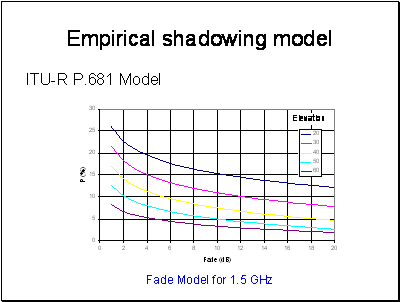
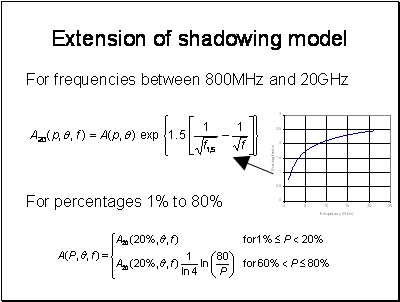
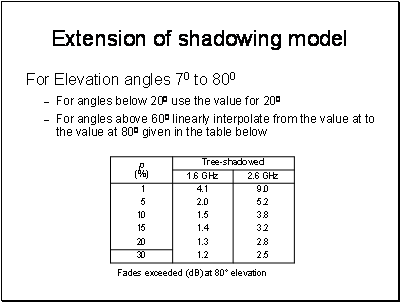
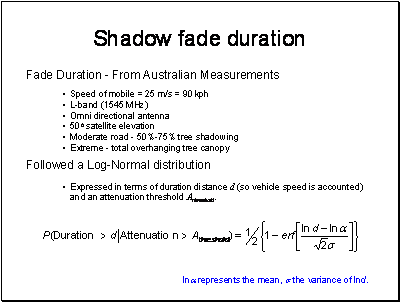
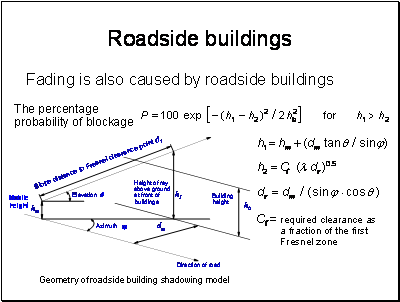
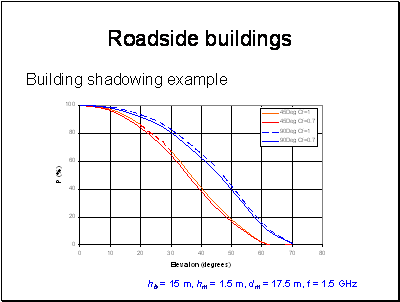
To apply this model, we need to know the distribution of building heights and the azimuth of the streets relative to the orbital position. The letter can be calculated from the geometry of the orbit.
The building height distribution has been found to measure a log normal distribution.
In Guildford the mean building height has been measured as 7.1m with a standard deviation of 0.27m. In Westminster the mean height was 20.6m with a standard deviation of 0.44m.
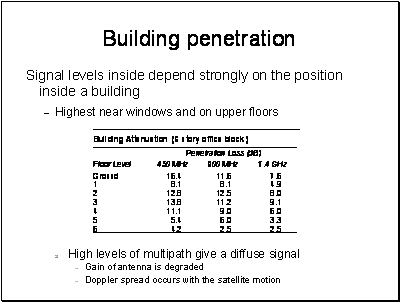
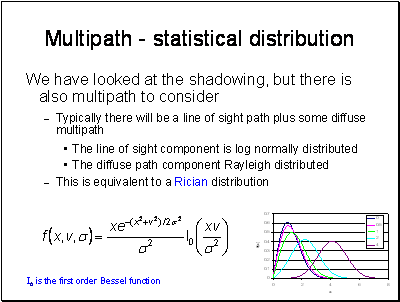
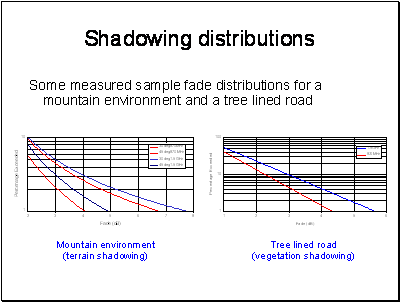
There are many models in the literature based on developments of this assumption. These take into account the distribution of shadowing and multipath as a mobile moves through an environment.
