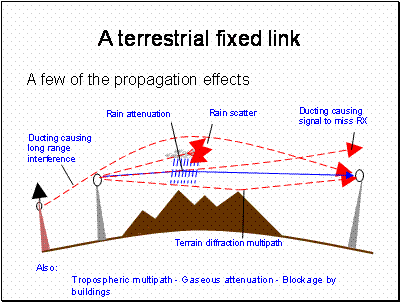
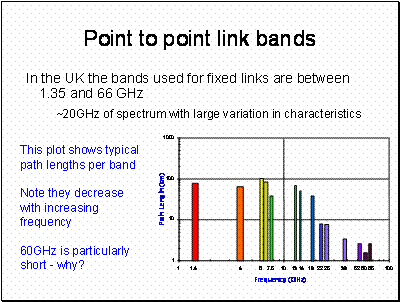
The main reason for the decrease in length with frequency is because of rain attenuation. The reason 60GHz is so short is that Oxygen attenuation at ground level can be 10dB/km. This severely limits the range of the link - or ensures privacy if you prefer.
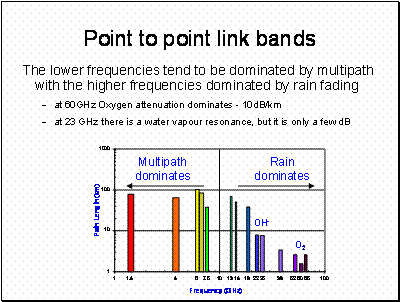
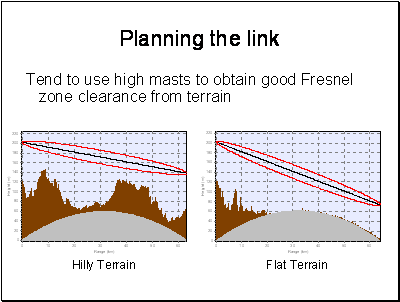
The need to get good Fresnel clearance is because of k-factor variation. Designers will typically aim for up to 4th Fresnel zone clearance assuming a k-factor of 0.9 or less.
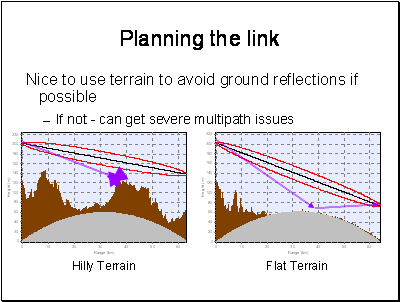
In practice it is often impossible to avoid ground reflections on longer paths in flat areas and with reasonable antenna sizes. The solution to this is usually to deploy two receiver antennas at different heights - the best signal being used at any time. The reason this works is that the phase difference of the multipath interference will vary with height and as a result, the spectral null will appear at a slightly different frequency for each antenna. As the k-factor varies, the received channel at one or other of the receive antennas will not be in the null.
What you need to do is to calculate the range of path length differences between the direct and reflected path as the k-factor varies, if this is always less than a wavelength appropriate transmit and receive antenna heights can be selected so cancellation never occurs on the link. Otherwise, diversity antennas may be needed.
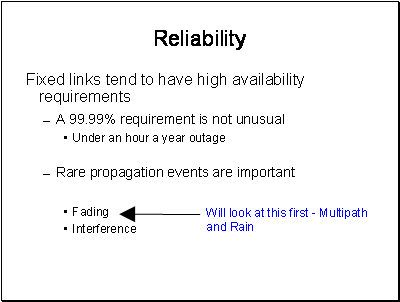
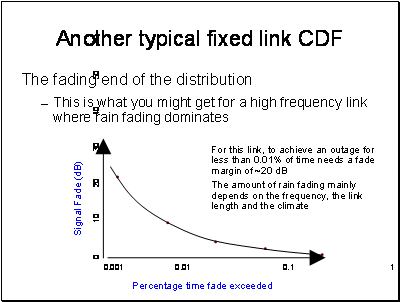
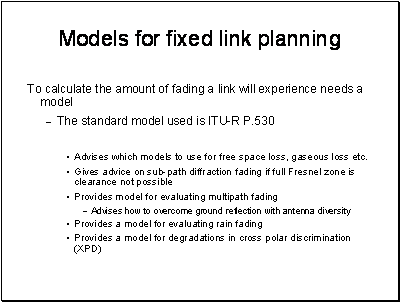
Whether the operators really need 99.99% or 99.999% is open to debate, especially if the hardware failure rate is much higher, but it is traditional. Lower frequencies tend to be dominated by multipath and higher frequencies by rain fading.
Interference is of special significance as there is great pressure on spectrum in some fixed links bands. We will come on to that later.
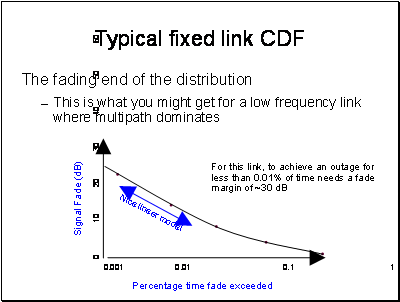
P530 is a long and detailed recommendation - here we will look at a few of the models it contains.
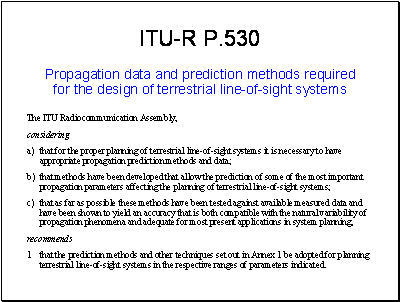
P530 Claims to inform on:
diffraction fading due to obstruction of the path by terrain obstacles under adverse propagation conditions;
attenuation due to atmospheric gases;
fading due to atmospheric multipath or beam spreading (commonly referred to as defocusing) associated with abnormal refractive layers;
fading due to multipath arising from surface reflection;
attenuation due to precipitation or solid particles in the atmosphere;
variation of the angle-of-arrival at the receiver terminal and angle-of-launch at the transmitter terminal due to refraction;
reduction in cross-polarization discrimination (XPD) in multipath or precipitation conditions;
signal distortion due to frequency selective fading and delay during multipath propagation.
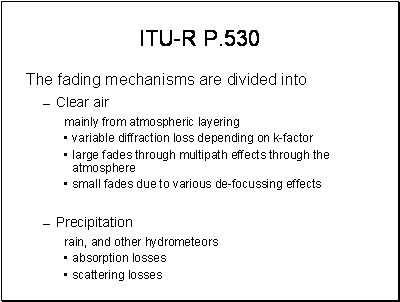
Obviously both of these can occur at the same time along a link, especially if it is a long one.
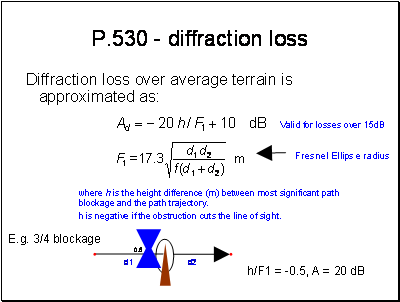
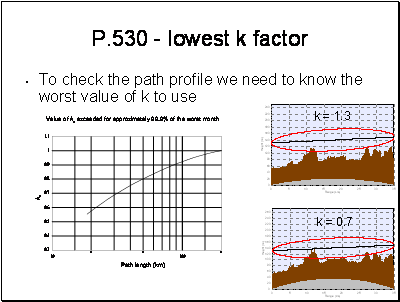
The two graphics show the effect of k-factor variations on the path blockage. In this case the path has sub path diffraction and the effect will not be very large. Other paths, especially at higher frequencies where the Fresnel radius is less can transition from being fully line of sight to fully blocked through k-factor variations.
It is also important to remember the limits of terrain data which may only be samples at 50m intervals. Even given good quality terrain information, path profiles do not give information on the height of ground cover - I.e. buildings and vegetation. Databases of clutter category, (Urban, Suburbs, Orchard, Lake, Fields etc.) are available and are usually accounted for using a mean clutter height which is added to the terrain height in checking for path clearance.
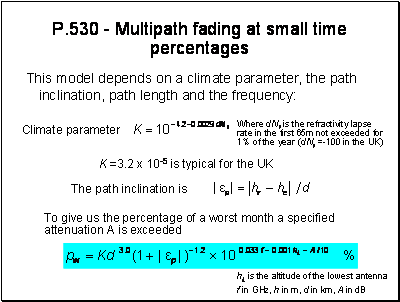
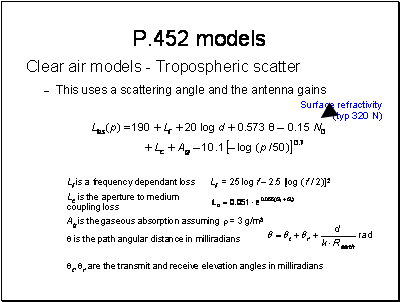
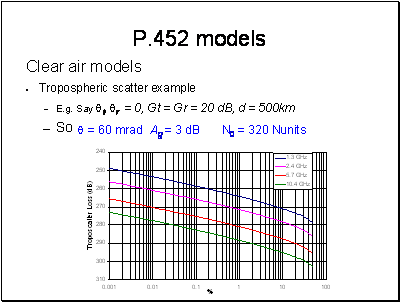
In the UK, N0 is of the order of 320 N units. dN/dh is between -100 and -200 N units per km.
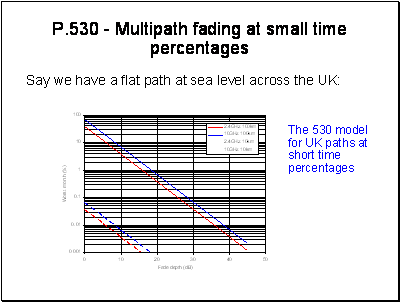
The graph shows a couple of example paths to size the effect. At 0.01% for typical link lengths and frequencies multipath fading is 5 dB to 40dB.
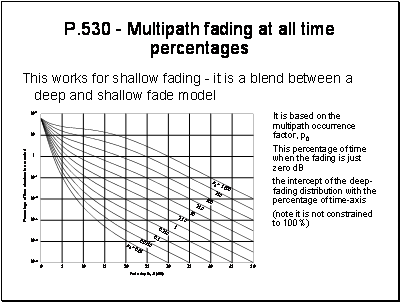
The actual method is simple but contains several equations which we will not go into here. The procedure is given in ITU-R P.530-11 section 2.3.2
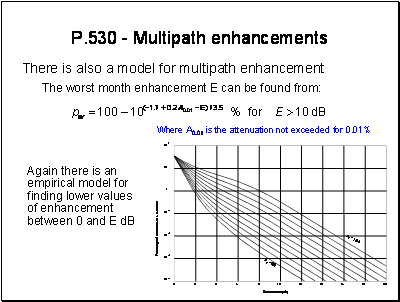
This model works in a similar way to the fading model - the enhancement percentage at E = 10 dB is found and the enhancements between 0 and E are a set of curves.
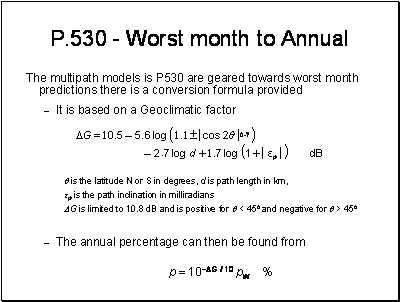
Again, this is an empirical conversion - to add to the uncertainty, there is considerable year to year variability in propagation. To be really sure of the statistics for percentages down below 0.01% really requires several years of measurements and the assumption that the climate has not changed over time. There is a fair amount of evidence, including results of long term radio link measurements, that the climate in the UK is changing.
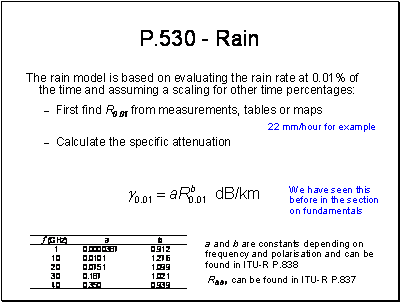
The equation above for specific attenuation comes directly from scattering theory - it is therefore a Physical model. That means it should be a good match to what is measured in practice. The constants a and b have been calculated for many rain rate distributions and for stratiform and convective rain. A representative set applicable to most of the world is provided in ITU-R P.837. These values do not necessarily work very well outside the mid latitudes, for example in the tropics where the rain drop size distributions are quite different.
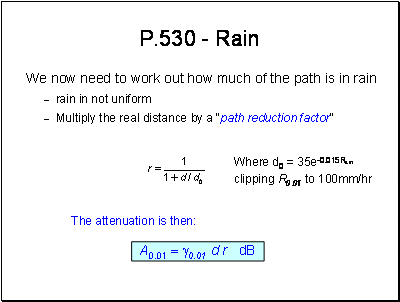
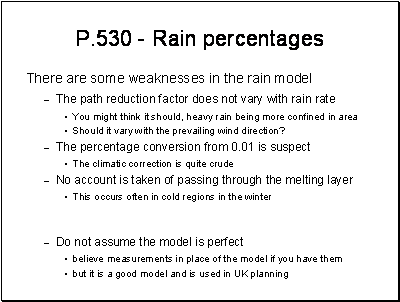
A simple path reduction factor is a bodge. It works but as an Empirical model it takes no real account of the different rainfields experienced in practice. Local geography may mean that the point rainfall rate measured at one point on a link is quite different from that found at another point on the link. This is especially true for long links and those in mountainous terrain.
In the static storm model of rain, static storms arise uniformly and are advected across terrain by the wind. Over periods of 10s of minutes, over flat terrain, this theory and hence the path reduction factor are good.
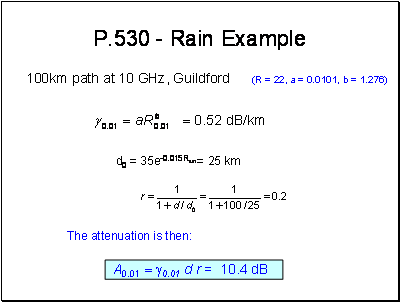
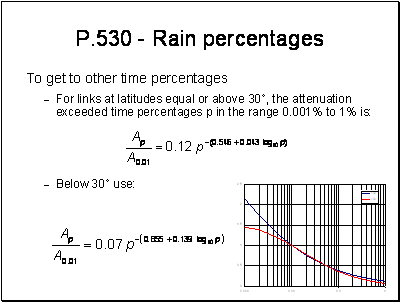
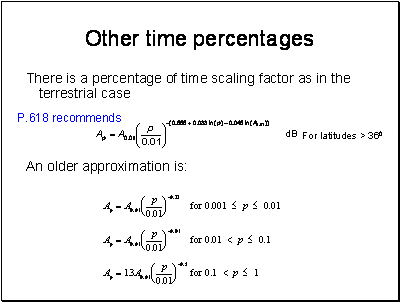
Do not try and use this fit outside the 0.001 to 1% range - it will do strange things, the low latitude formula is not monotonic.
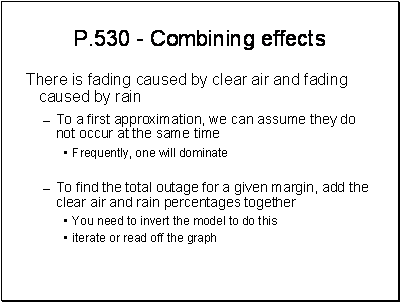
The assumption that the effects do not occur at the same time becomes progressively less safe at higher time percentages. As most engineers are interested in what is occurring on the link for small time percentages this to some extent does not matter.
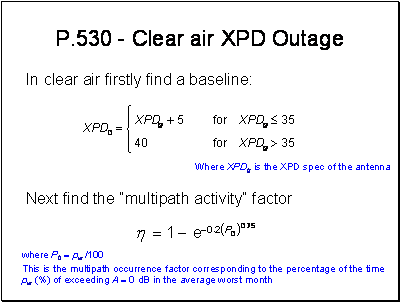
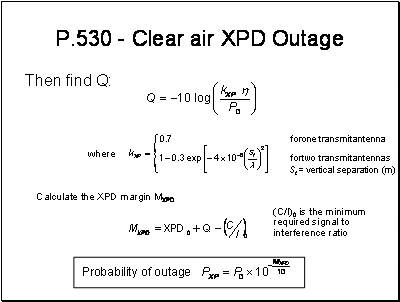
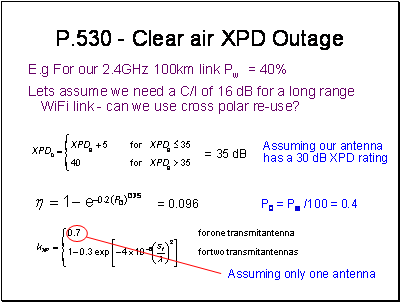
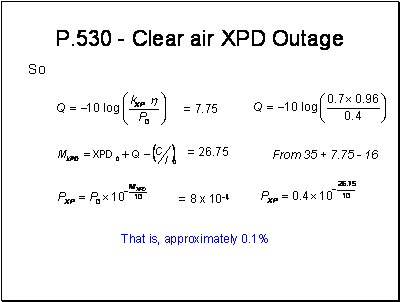

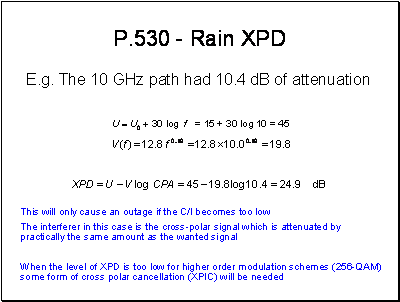
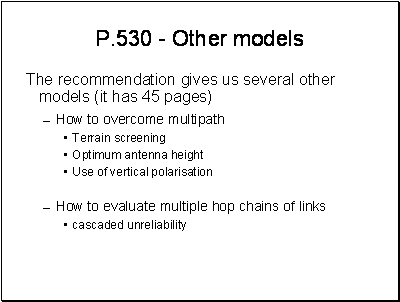
Not intending to go into these time is limited. These are important models for the system designer but fairly specific to fixed link systems.
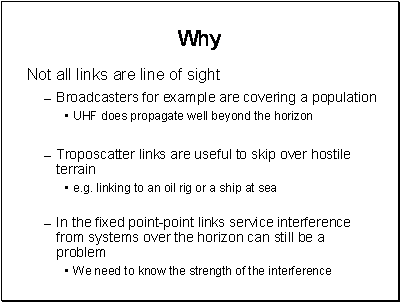
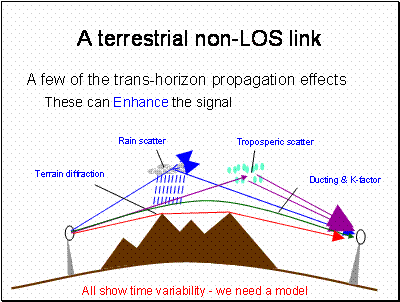
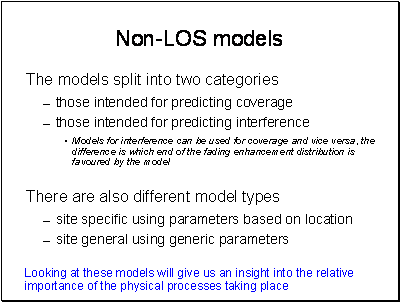
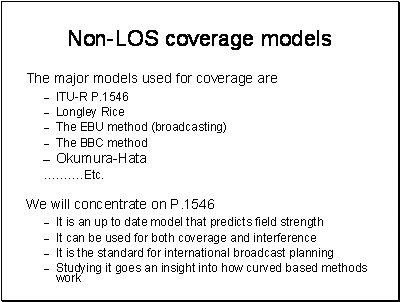
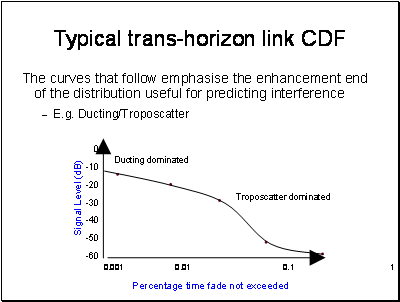
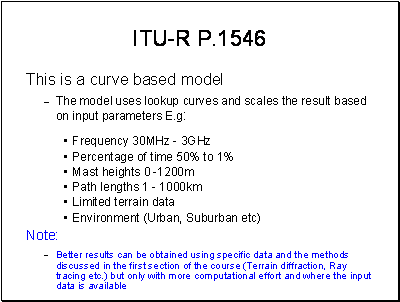
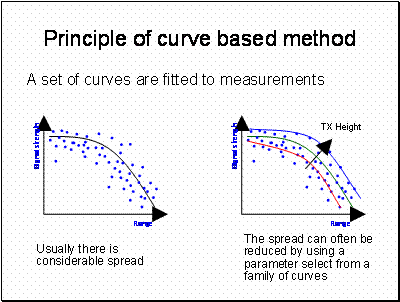
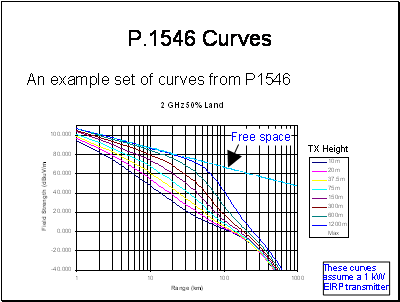
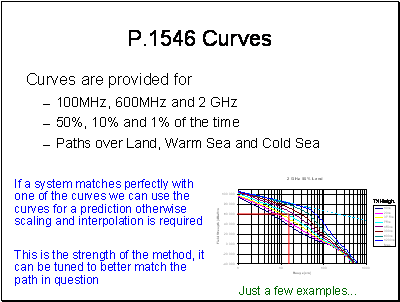
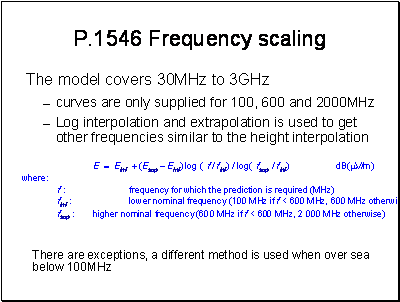
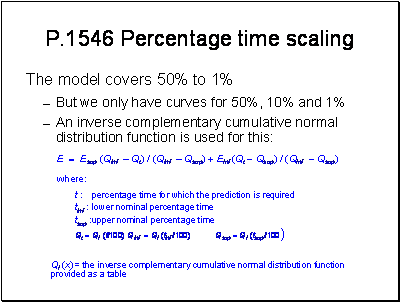
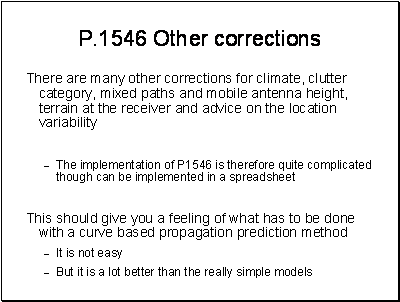
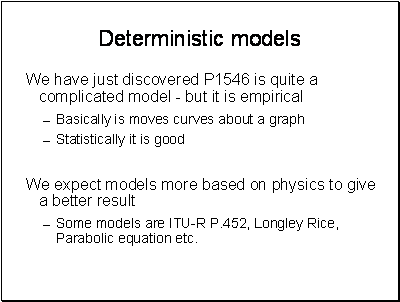
P1546 is in effect an Empirical model. It attempts to predict the result for an average location and covers location variability with an estimate of what that variability is. Given a good enough database it would be possible to plan a service like a TV transmitter coverage area or the coverage range of a PMR system using deterministic models for the terrain diffraction loss, the tropospheric scattering, and the variability in k-factor. It is also possible to predict interference through models of the incidence of anomalous propagation. The problem is the broadcaster does not know exactly where the reception points will be.
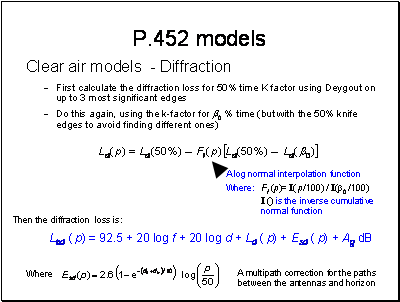
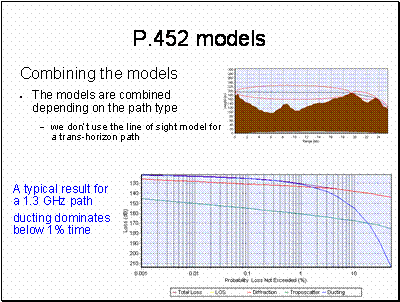
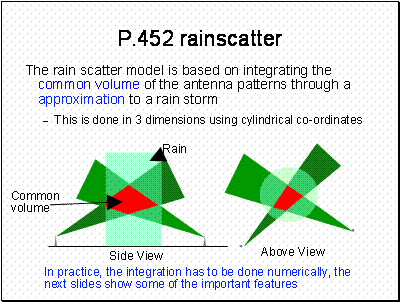
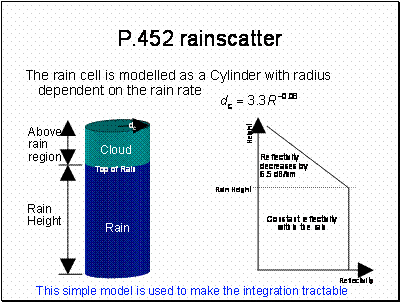
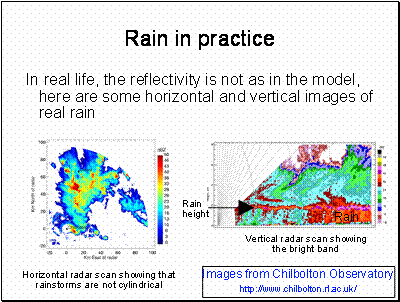
The solution is to assume that they are spread on a regular grid and calculate deterministically using physical models the propagation effects on the path from the transmitter to each point on the grid. This may later be weighted by population density, potential income, or some other metric regarding the target audience. Calculation over a large number of points takes a lot of computer time, but is becoming practical as computers get faster. There is now a move to develop more deterministic models that can take advantage of improved data sets and computer power. We will cover once of these more deterministic physical models, ITU-R P.452 later.
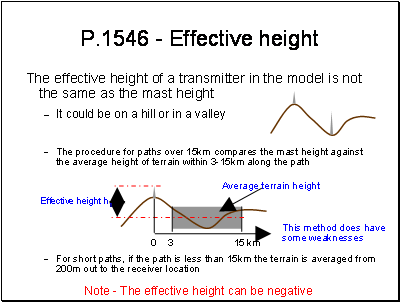
The method ignores terrain with the first 3km, this tends to assume the transmitter has a clear view out to at least 3km. This is likely to be true for broadcast systems for which the model was originally designed, but is not as likely to be for mobile systems with 10m masts.
There is also a problem with sloping ground. Paths (a) and (b) below are exactly the same, just rotated. The clearance is exactly the same, but the effective height for (b) is much greater.
The ITU-R are working on improving this part of the model.
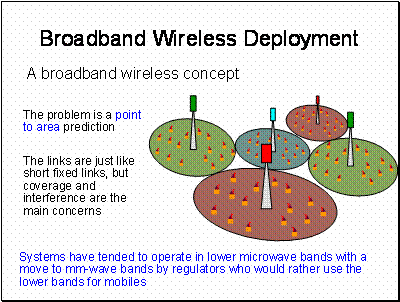
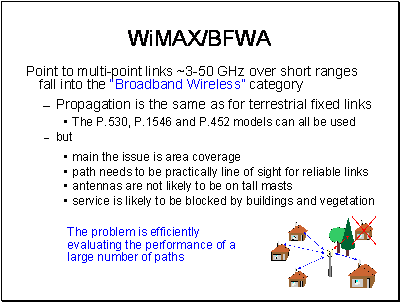
Models for propagation effects are used in planning radio systems and for designing efficient ways of overcoming any limitations imposed by the path. Broadband wireless access systems tend to require models that cover link ranges of up to around 10km for the frequency bands where sufficient spectrum is available to provide high speed connections to many customers.
The main questions to be answered are can a customer be served, what are the channel characteristics and how does this vary over time. A secondary question that is very important if using spectrum efficiency concerns the interference environment. Systems need to be able to re-use spectrum and to do this a model for the relative strength of the wanted signal against all interferers is needed.
General statistical coverage models for broadband fixed wireless have been around for several years. The results of these models are useful in the initial stages of planning a system, answering questions such as how coverage changes with antenna height, what range can be expected from a link in a rural area compared to one in an urban area and how many base stations are needed in a point to multipoint system to cover a typical town.
Although statistical models can be run on a simple spreadsheet and they are very useful in initial system evaluation, they are less useful when implementing a service where the likelihood of coverage to a site is not specific enough. Sending out an installation engineer to find out is too expensive – so better models are required. As PC power has improved, these now tend to be based exclusively on Ray trace techniques.
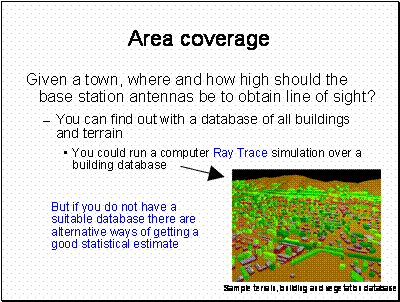
By its nature, accurate clutter data is difficult to obtain and can date rapidly, especially the data for vegetation.
A system deployed in the winter may become unreliable in the spring when leaves appear on trees, or maybe a few years after installation on a new estate when the newly planted trees have grown.
Buildings have a large effect on the radio channel. They provide an opportunity to site an antenna and can block the line of sight. Reflections and diffraction around buildings can increase coverage and can cause multipath.
Until recently, detailed building vector data had to be produced by a manual extraction process based on stereo aerial photography; an expensive and time consuming task. The figure above shows a section of Malvern and was produced using this method.
The development of airborne Lidar surveying has greatly improved the availability of building data, which is now available for many major towns and cities or if not can be obtained quickly and reasonably cheaply. There is now much research being done on how to perform Ray trace predictions over large databases within a reasonable amount of CPU time.
Coverage models based on ray tracing are also useful in indicating coverage on other paths. In a multi-user network, the closest viable link is not necessarily the best one to use; it is good to have a choice to avoid congestion bottlenecks. When rain fading is a limiting factor, the ability to use a backup link may be crucial to meeting the reliability specification.
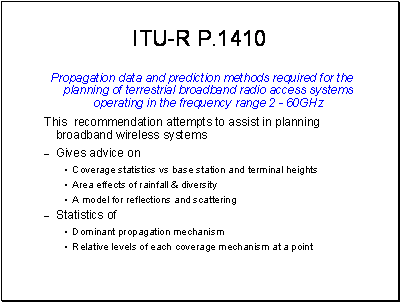
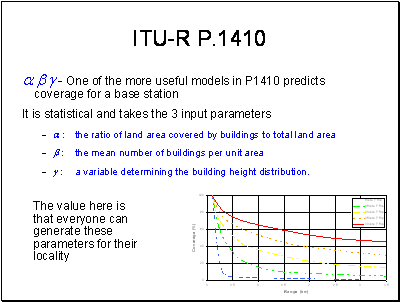
To predict the likelihood of coverage to an area, only a statistical distribution of building characteristics is needed, ranging through for example a simple categorisation, “Urban”, Dense Urban”, Village” or as parameterized data a, b ,g.
The models developed in ITU-R P.1410 that predict coverage probability can also be used in evaluating interference, which is analogous to unwanted coverage. Interference is usually modeled to greater distances than the intended coverage.
Coverage likelihood derived from empirical models like this is useful in the system design stage, but when attempting to determine if a given customer can be served a more specific prediction is needed. In order to make predictions to individual locations, detailed building data must be obtained to allow more advanced simulations, for example using ray tracing techniques.
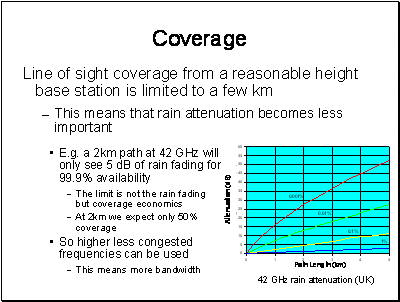
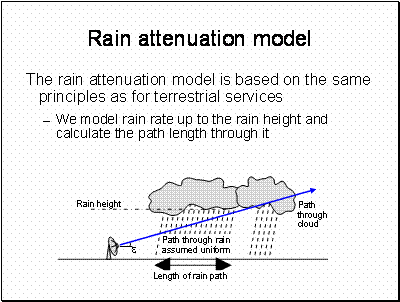
Radio links in the higher frequency bands are effected by fading when there is heavy rain. This generally limits the overall availability of the link. There is a well established and accurate rain fade model within the ITU-R P.530.
This model is based on the statistics of rainfall. As local climates can be so variable, rain rate statistics must be known or estimated for the area of interest based on the ITU-R rain rate maps.
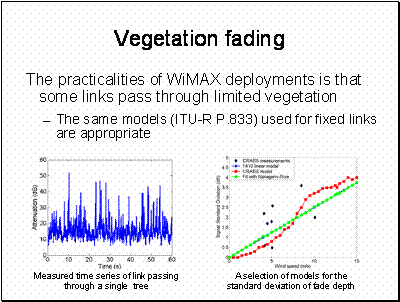
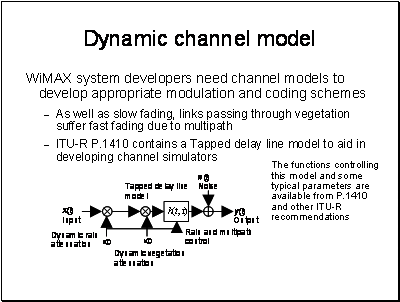
In the combined model above, the rain attenuation function r(t) is derived from the synthetic rain field model or for a single link from the Maseng-Bakken1 model.
The vegetation attenuation function v(t) is derived from the ITU-R P.833 vegetation model including the dynamic effects due to wind.
A tapped delay line model for multipath uses a function h(t,t) which is derived from measurements from channel sounders.
Additive white Gaussian noise is introduced at the final stage, where interference signals can also be added if necessary.
1 - T. Maseng and P. Bakken, “A stochastic dynamic model of rain attenuation,” IEEE Trans. Comm., vol. 29, pp. 660 – 669, 1988.
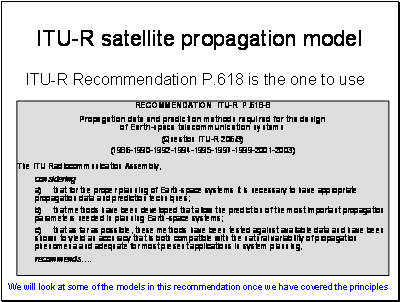
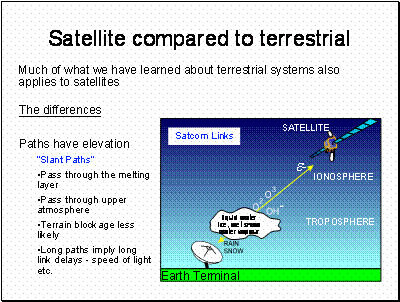
These are the main effects to consider
a) absorption in atmospheric gases; absorption, scattering and depolarization by hydrometeors (water and ice droplets in precipitation, clouds, etc.); and emission noise from absorbing media; all of which are especially important at frequencies above about 10 GHz;
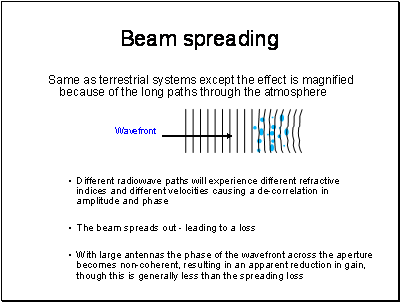
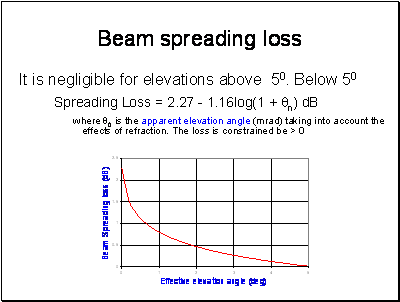
b) loss of signal due to beam-divergence of the earth-station antenna, due to the normal refraction in the atmosphere;
c) a decrease in effective antenna gain, due to phase decorrelation across the antenna aperture, caused by irregularities in the refractive-index structure;
d) relatively slow fading due to beam-bending caused by large-scale changes in refractive index; more rapid fading (scintillation) and variations in angle of arrival, due to small-scale variations in refractive index;
e) possible limitations in bandwidth due to multiple scattering or multipath effects, especially in high-capacity digital systems;
f) attenuation by the local environment of the ground terminal (buildings, trees, etc.);
g) short-term variations of the ratio of attenuations at the up- and down-link frequencies, which may affect the accuracy of adaptive fade countermeasures;
h) for non-geostationary satellite (non-GSO) systems, the effect of varying elevation angle to the satellite
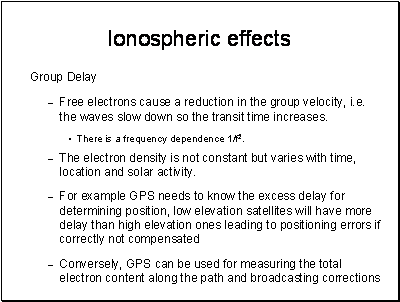
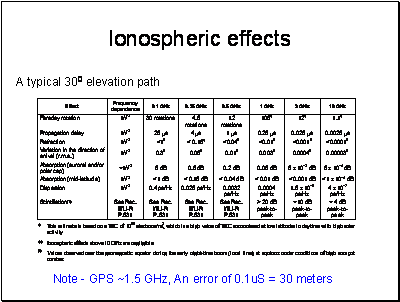
Ionospheric effects may be important, particularly at frequencies below 1 GHz. For convenience these have been quantified for frequencies of 0.1; 0.25; 0.5; 1; 3 and 10 GHz in Table 1 for a high value of total electron content (TEC).
The effects include:
j) Faraday rotation: a linearly polarized wave propagating through the ionosphere undergoes a progressive rotation of the plane of polarization;
k) dispersion, which results in a differential time delay across the bandwidth of the transmitted signal;
l) excess time delay;
m) ionospheric scintillation: inhomogeneities of electron density in the ionosphere cause refractive focusing or defocusing of radio waves and lead to amplitude fluctuations termed scintillations. Ionospheric scintillation is maximum near the geomagnetic equator and smallest in the mid-latitude regions. The auroral zones are also regions of large scintillation.
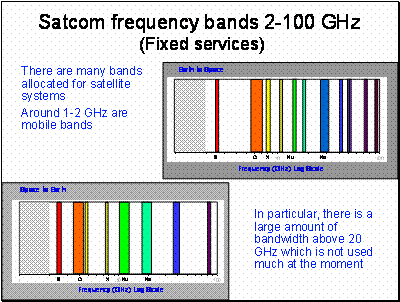
2.5-2.69
3.4-4.2
4.5-4.8
7.25-7.75
10.7-12.7
17.7-21.2
37.5-40.5
81-84
102-105
149-164
231-241
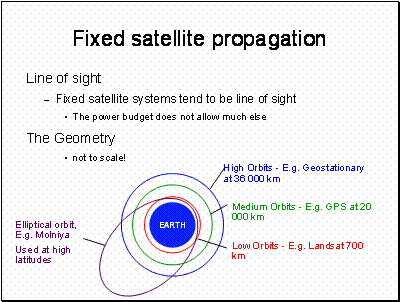
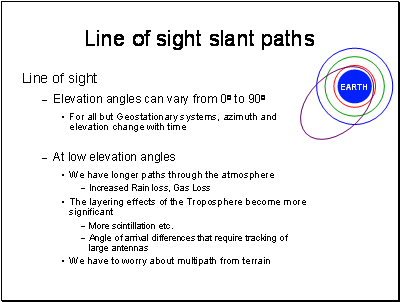
There are an infinite number of potential orbits, but those we are going to consider most are the Geostationary Orbit for fixed services, and low orbits for mobile services.
It is important to remember the propagation delay - the speed of light is finite and a signal sent via a Geostationary satellite will take a quarter of a second or so to make the 72 000km trip.
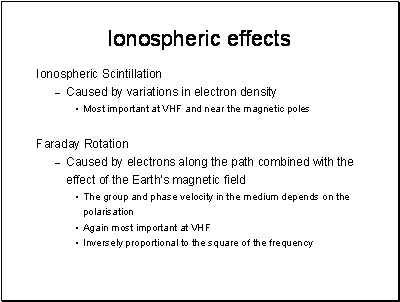
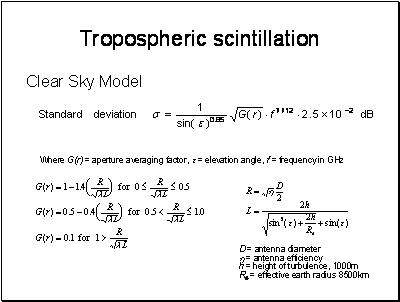
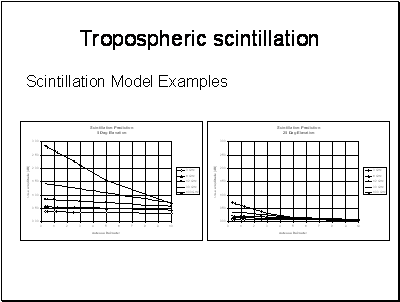
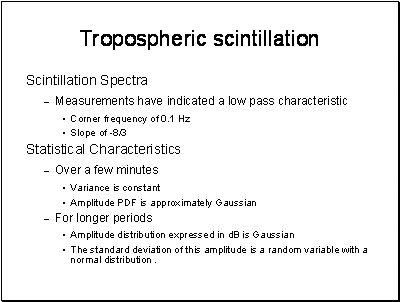
Scintillation can be a problem at C-band, for example, scintillation of up to 5 dB peak to peak have been recorded on links to Hong-Kong for 0.01% of the time. However, it is mainly a problem in the lower bands.
Faraday rotation by the ionosphere can reach as much as 1° at 10 GHz. The planes of rotate in the same direction on the up- and down-links. So it is impossible to compensate for Faraday rotation by rotating the polarisation of the antenna when the same antenna is used both uplink and downlink.
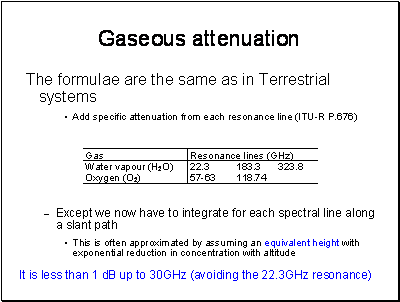
Here is a simple method to work out slant path gaseous losses
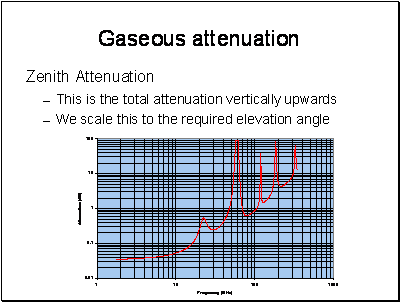
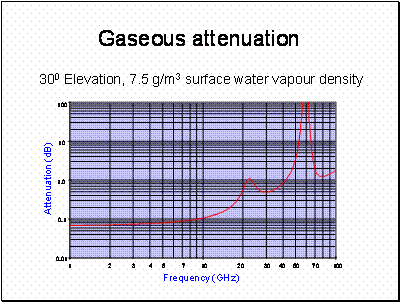
This graph was generated using a simple approximation for the elevation angle.
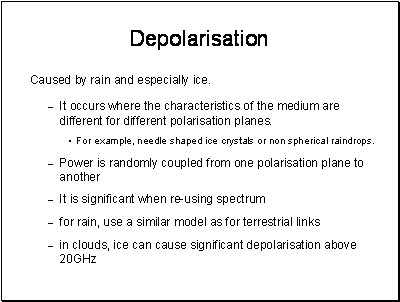
The ice model is long which is why it is not given here.
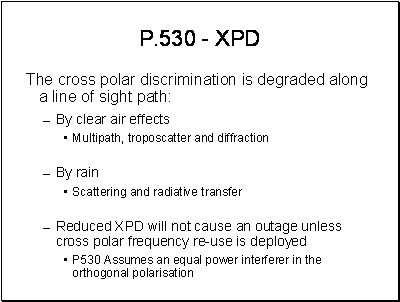
Frequency reuse through orthogonal polarization is often used to increase the capacity in telecommunication systems. The cross-polar isolation is an important factor in determining the interference into each orthogonal channel from the other. Rain depolarisation limits the isolation.
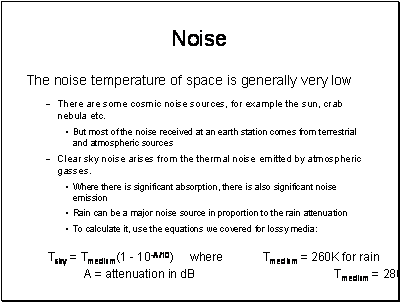
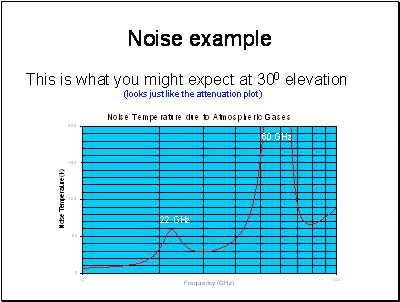
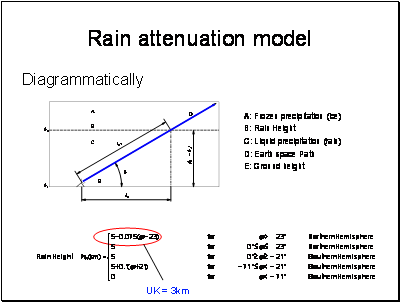
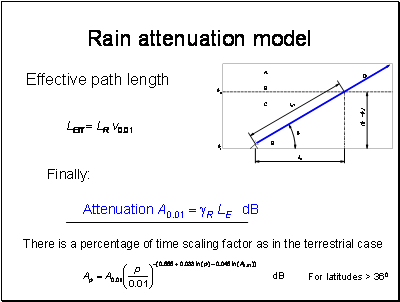
Note - This rain height model is basic and does not account for season.
Correction factors:
Convective Regions (e.g. Mountainous Terrain) + 300m
Maritime Regions (- 500m)
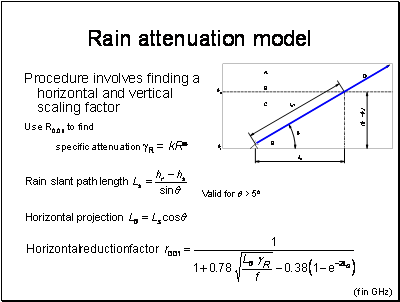
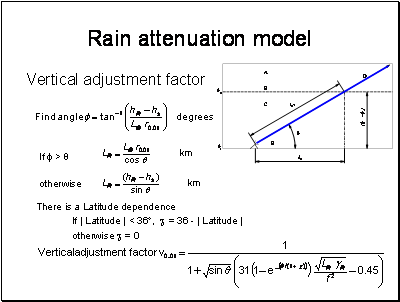
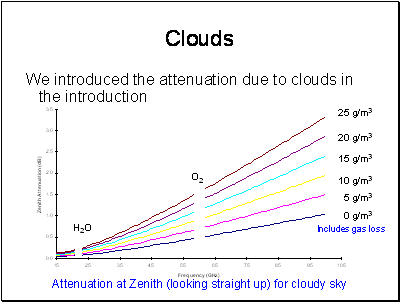
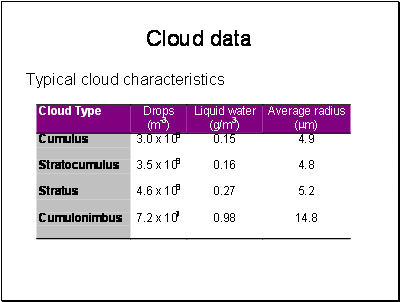
This data is of course highly variable
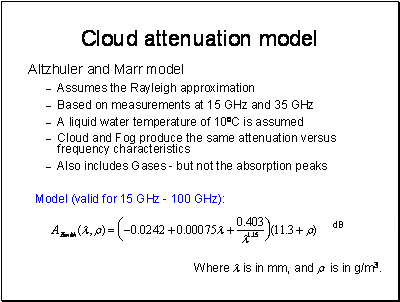
This simple model is not pat of the ITU-R recommendation. That model is much more refined. However, this does give an indicative value to use in preliminary planning.
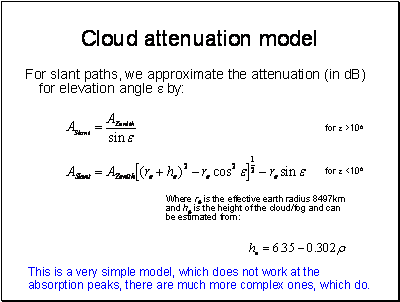
1/sin e really is cheating - but it is good enough for many purposes.
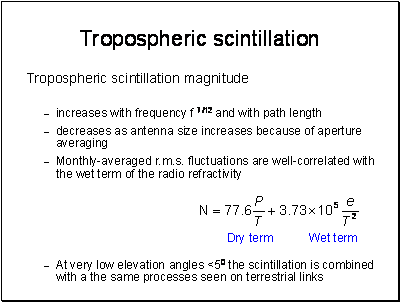
ITU-R P.618 gives a detailed model for estimating scintillation on satellite paths.
