
Some software - to be extended.
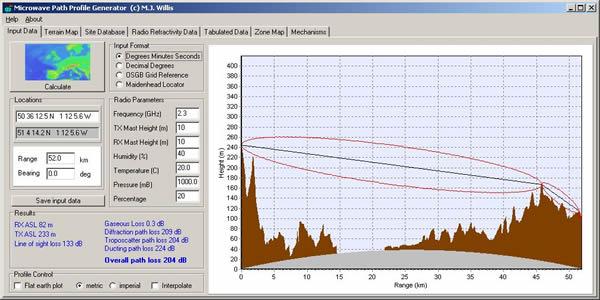
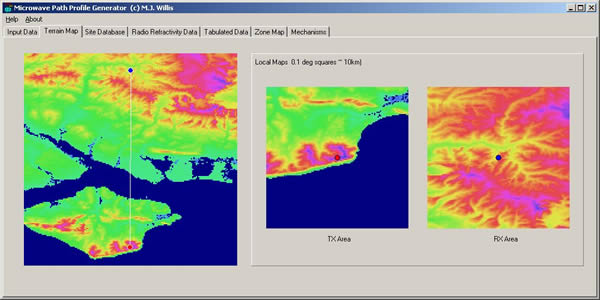
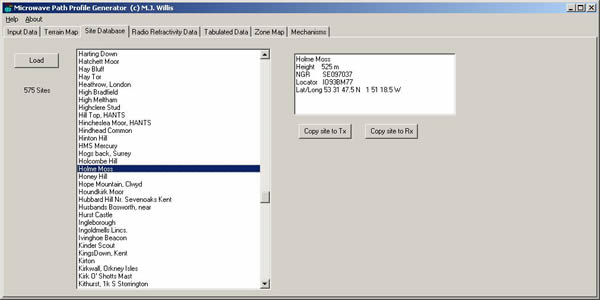
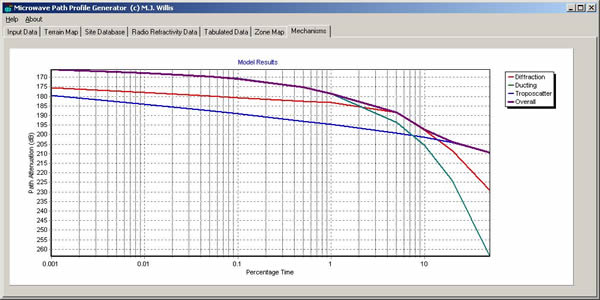
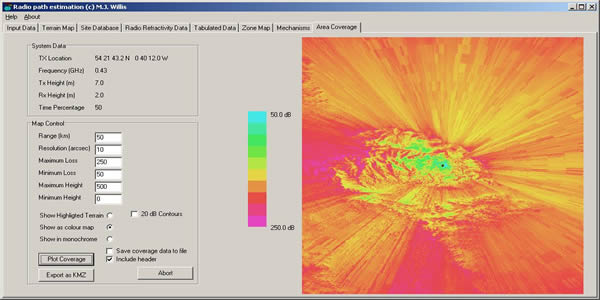
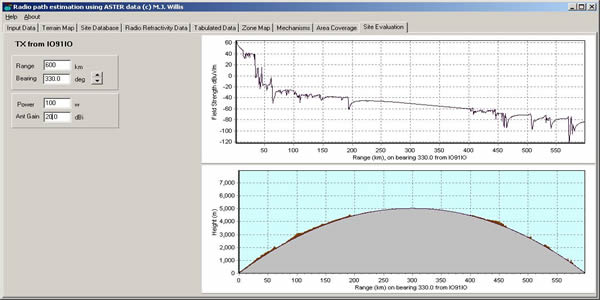
Path Profile - UPDATED 6/10/18 ( ASTER SRTM Updated to a more recent compiler which will work better with higher resolution displays.. New features limited, different colour maps and addition of locator reading in terrain plot, help file added. Sites database also reads mast height and frequency options to the sitelist file, sites.dat. The new sitelist file should be compatible with older versions but if you want to add height and frequency to a record you can now do so. This will mainly only be useful for beacons and it is not too clever, height first and frequency second, not the other way round. Use m or ft for height and GHz for Frequency). I have also attempted to make it work with the latest SRTM high resoluton data which is now available in geotiff format at 1 arcsecond from USGS. Very much a test and this data not available at all latitudes. If it works I will be surprised, anyway this is done through the ASTER version of the program which first looks for Aster version 1 data (eg ASTGTM__N50W002_dem.tif), then if not found Aster version 2 data (eg ASTGTM2_N50W002_dem.tif) and if still not found it will look for the 1 arcsecond SRTM data (eg n51_w002_1arc_v3.tif. After that it gives up. One day I aspire to have one program to read all formats but its too much time. Ian GM3SEK pointed out that he would be happy with a program that produced a path profile, which could then be fed into other software. To address this I have developed the utility below which generates a profile using SRTM .HGT data, which you will need to download. You will need the one degree tiles. Be warned - it is a lot of data but you have to have large files to get high resolution. It is best to start with just the local ones. The entire database is 30+ Gbytes, but it is entirely possible to download this via broadband. The Shuttle data, (SRTM) has at least ten times the resolution of GTOPO30. The version used here is the 3 arc second data (~90m in Europe). It is available here and for this utility, only the .HGT files are needed. Here are some local files for Southern UK. This site has loads of very useful tiles. In 2009 the ASTER (Advanced Spaceborne Thermal Emission and Reflection Radiometer) terrain data was released to the public by JAXA/NASA. This data has a resolution of 1 arc second (approx 30m pixels) for much of the world. You must register to get the ASTER data but beware, because of the increased resolution the tiles are 25Mb each. I have updated my software to read this and added a few enhancements including export to Google Earth and contouring - this is the ASTER version. Here is an example of a KMZ file for Google Earth. When you unzip the utility you will notice several data files - these need to be in the same directory as the program. On a first run, it will probably ask you where the terrain data files are. Just select any one of the SRTM or ASTER files and it will be OK. If you then save the input data it should find it on subsequent runs. Features: I have developed the program to do other things which may be of interest; Specifically predictions of path loss and coverage from a site. Path Loss Prediction The path loss model used covers 30MHz to 3GHz and ranges from 1km to 1000km. In practice most of the models should work properly up to at least 30 GHz. Note that at higher frequencies, the model can only be as good as its' input data and it knows nothing about the location of vegetation and buildings. The Troposcatter model is only valid up to 1000km. Site Database I have included a facility to work from a site database, the site data is in the same format as the G4JNT Geog program. Terrain and Zone maps There is a terrain map display facility, if you ask for a large area it may take some time to plot. You can also plot the climatic zone data which is used for estimating the probability of ducting. There is also a display for climatic zone, that is Inland, Sea and Coastal as per ITU definitions. This is at lower resolution to make the file size practical to supply. Area Coverage A prototype area coverage model is also included. Beware that this is fairly slow as it needs to work out the path loss to a large number of points. It is memory intensive as it uses caching to speed up data access. The best thing to do is to make a draft plot using a large initial pixel spacing. When it looks like what you wanted, produce a high resolution version. Warning about HGT data I chose .HGT as it is the most commonly available format for SRTM data. Several groups have been working on improving the quality and coverage of the raw data and there is now even pseudo-data available for regions above 60 degrees latitude that were not covered by the SRTM mission. Data is almost always supplied compressed in the .ZIP format. Winzip may not decompress this properly until you have disabled the "smart" CR/LF substitution. Each file should be exactly 2,884,802 bytes. The best place to put the .HGT data is the same directory as the program. |
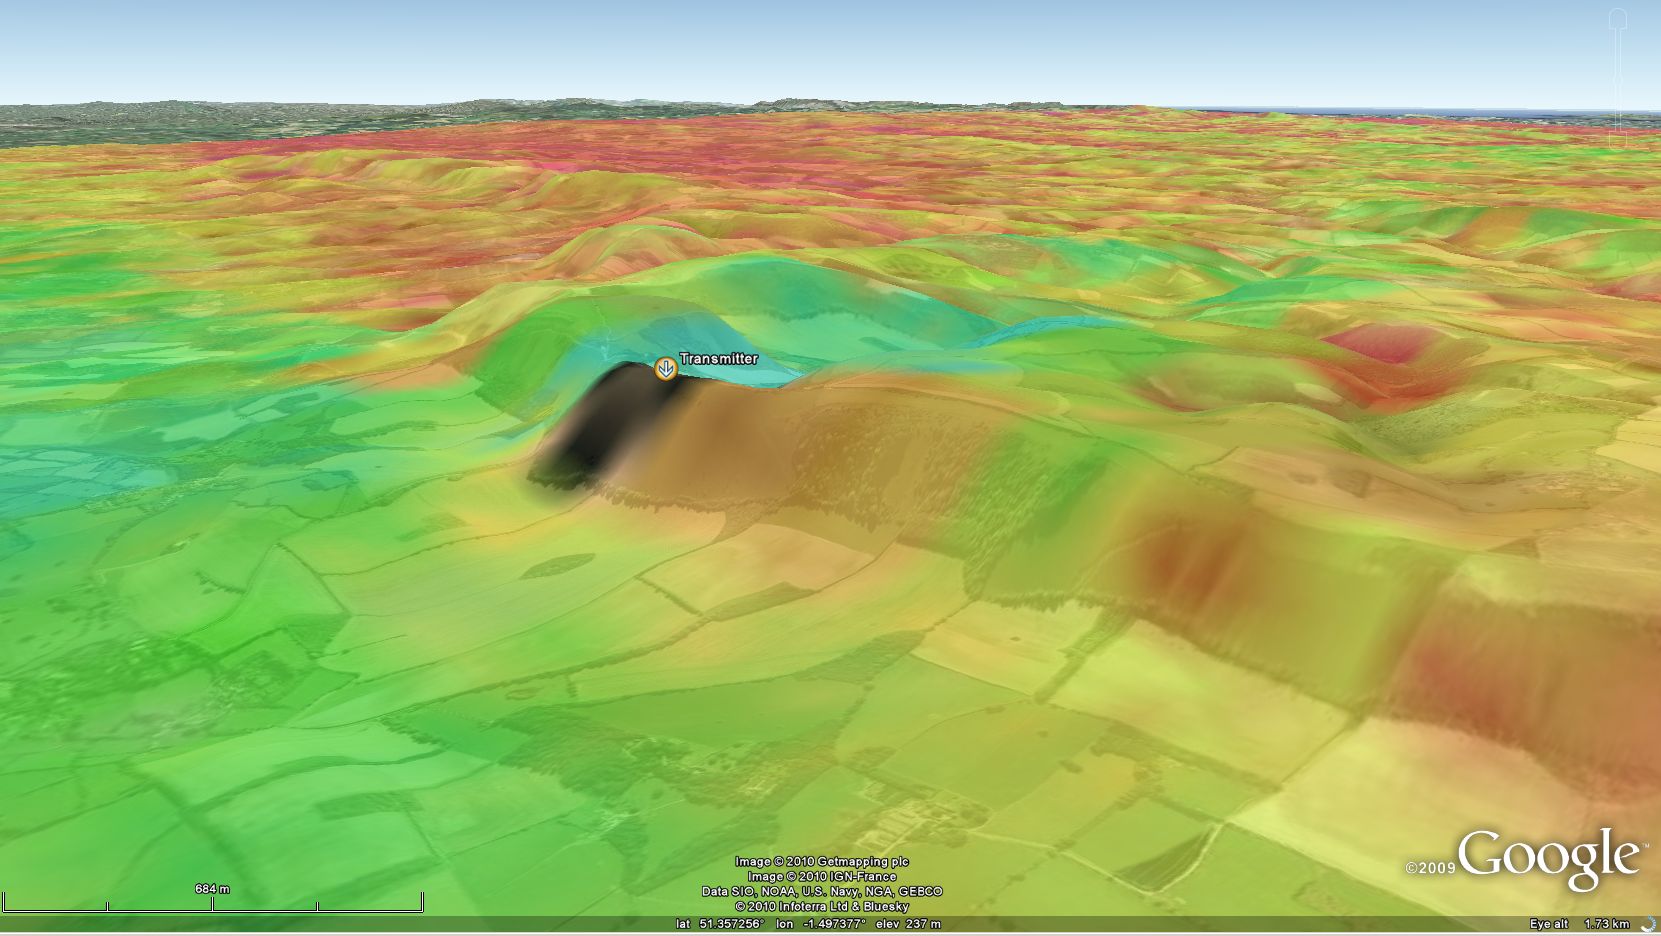
Google Earth coverage example (Coombe Gibbet 1.3GHz) |
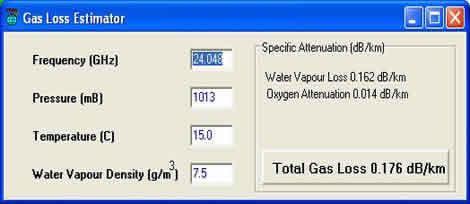
Other Software This is a simple little utility implementing the curve fitted model for gaseous attenuation based on the model in ITU-R P.676-6 from 2005. This should be more accurate than the simple model. The specific attenuation is useful in estimating the losses that are experienced in addition to the free space loss due to absorption by atmospheric gasses. The equations are good to 180GHz. If you can't work out water vapour density from humidity, see my tutorial. 7.5 grammes per cubic metre is typical at sea level and 15 would be humid. If you are estimating the loss in a surface duct, 3 grammes per cubic metre is a reasonable figure to use. |
 |
Updated 3/8/09 to fix bug in Maidenhead extended format. Note - This uses an older version of the sites database, it is more flexible and in plain text and the format is quite obvious from the example. |
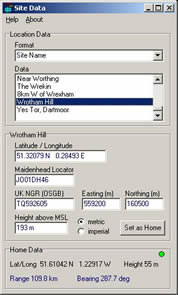
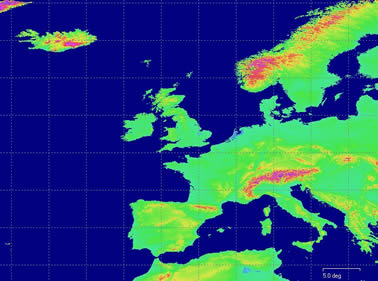
Site Data - A utility to convert between locators and display terrain height at a point. It will also calculate distance and bearing from a home location. The height data is based on the GTOPO30 database, with an example plot for Europe shown below. A small data set map is included in the distribution.
There is an issue with Lat Long, you need to know what your Datum is and in particular which Geoid. A Geoid is a model of the Earth taking account of the non-spherical nature of the earth. GPS, Google Earth etc use a datum called WGS84 which covers the whole earth reasonably well. The OSGB use Airy because it is better for mapping the UK. There is a difference so if you do the standard conversion from OSGB to Lat/Long, you get Lat/Long referenced to the Airy Geoid. If you then try and plot this on Google Earth, you will see an offset because of the different Geoid. Neither is wrong, but they are significantly different enough to notice. |
© Mike Willis May 6th 2011